Numbers don't lie: Cubs stats 1st edition |
We’ve elected to try something new: A feature that will run on the Cubs’ off-days, designed to keep you up to do date with the latest offensive and pitching stats, combined with a system I’ve developed to rank/rate players (more on that later). I’ve chosen off-days to calculate the stats and ratings because Baseball-Reference tends not to get statistics reported until the morning following the games. The stats will be current as of the most recent off-day, then posted on the site before the next scheduled game.
There’s little doubt that fans, and presumably the team, are seeing some ugly trends already, but things are always clearer in black and white (although I’ve added a little color added to break up the monotony.) Numbers have always intrigued me, and I’m a firm believer that stats don’t lie. Some of the charts below are straight forward and simple, while the rankings and ratings take time to calculate. It’s ok, I love this stuff, although I think my colleague, Dan Marich, may start a Go-Fund-Me account for me, to help pay for a box of calculators and a psychiatric evaluation. Here we go.
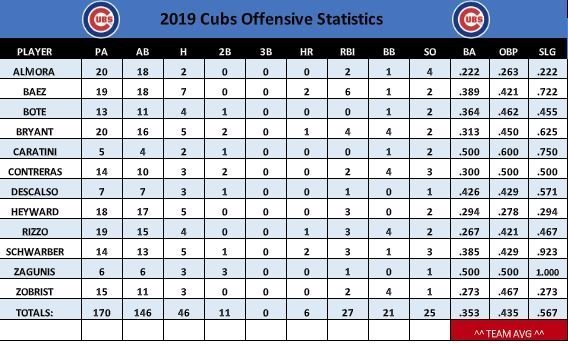
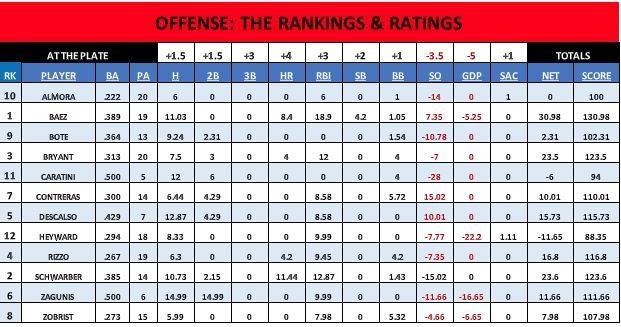
Overall, the offensive statistics, so far, look really good. The Cubs struggled at the plate (and in the field) on Monday night against Atlanta, but a strong opening series in Texas still has team averages. The Cubs are currently slashing .353/.435/.567 as a team, and you can’t ask for much more than that. Of the six homers so far, Javier Baez and Kyle Schwarber have combined for four of them (2 each). The team strikeout percentage currently sits at a modest 14.71%, while they have a 12.35% walk percentage. Almora leads the team in strikeouts (4), while Anthony Rizzo, Willson Contreras, Ben Zobrist, and Kris Bryant are tied for most-walks with four each. While Zo has always been able to draw walks, Contreras and Rizzo have both found patience at the plate this season. The team has racked up 17 extra-base hits in 4 games, with 11 doubles and six home runs. Surprisingly, to some, Mark Zagunis leads the team in extra-base-hits, as all three of his hits have resulted in doubles. The two areas that I see the team struggling offensively in is with sac-hits and sac-flies (not shown in this chart), with only a total of two, thus far (Almora and Jason Heyward). With seven in four games, hitting into double-plays has also become a little bit of an issue, especially for Jason Heyward who has now hit into four of them Baez, Zagunis and Zobrist have hit into one each). While the Cubs have tried to run a little more on the bases this year, Javier Baez is the only player to have successfully stolen a base, and he’s done so twice. Cubs’ Offense: Player Rankings & Ratings I’ve been working hard on developing a way to rank/rate players that takes subjectivity out of the equation, and I’ve finally found it. When things aren’t in “like-terms,” it’s impossible for exact comparisons, as you’re comparing apples to oranges. It’s sort of like adding fractions- you have to have common denominators, or you can’t get the right answer. What I’ve developed works a little like ERA, in that everything gets based off of three set numbers (like in the case of per 9 IP for ERA), but there’s a lot more factors and variables involved. I can explain it briefly, but for obvious reasons, I’m not going to share exactly how I do this. First, every player starts with 100 base points. Players are awarded a positive number of points (per occurrence) for H, 2B, 3B, HR, RBI, SB, BB, and sacrifices. Negative points are awarded for each incident of striking out or hitting into a DP. Once a player’s stats are entered, they are multiplied by the point value associated with each category (for example 3 hits x 1.5 points per hit, or, in the case of strikeouts, it would be three strikeouts x -3.5 points each). Still with me? The next part gets a little tricky… To make things proportionate, the player’s numbers are then multiplied by whatever number would make them proportionate to his teammate’s numbers. For example, if Baez has three hits in 6 plate appearances, it would be 3 x 1.5 for a total of 4.5. If Rizzo has one hit in 3 plate appearances, his score would be figured as 1 x 1.5 x 2, to make his numbers proportionate to Javy’s, as Javy had twice as many plate appearances. So, while Javy’s three hits are worth 4.5, Rizzo’s one hit is worth three points, as he needed fewer chances to accumulate it. After all of the scored factors are totaled, you get a net score. The score is then either added or subtracted (depending on whether the net is a positive or negative number) from the base score of 100 to get the final rating score. The higher the rating score, the higher the player is ranked. Two more things- negative scores are in red, positive in black; batting averages are the player’s actual average and have no bearing in the scoring. Someone recently asked me why I would say these results cannot be argued- my answer is simple- it’s because everything you see here is based on equivalencies. Javy’s stats are made proportionate to Bryant’s, KBs are proportionate to Heyward’s, Heyward’s are made proportionate to Schwarber’s and so-on. You can dispute the results based on your personal opinions, but you cannot dispute them based on the numbers.
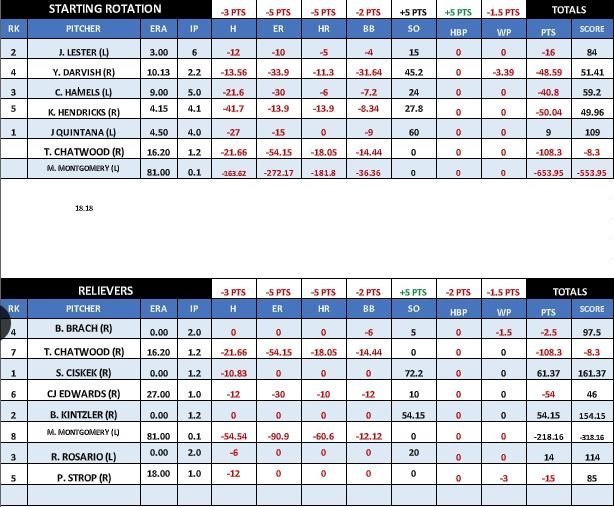
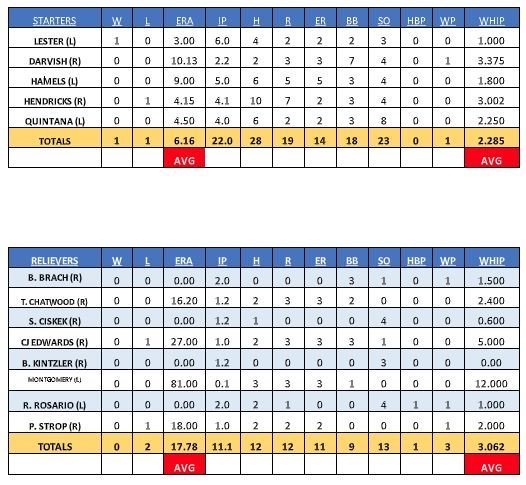
Let’s face it, for the most part; the starters got pounded in the opening week. Yu Darvish couldn’t last through the second inning, Kyle Hendricks got rocked, and they tagged Cole Hamels for five runs in a single inning. Jose Quintana looked good, tallying eight strikeouts, but he was used in relief of Darvish and not as a starter. If the rotation seemed a little “off” this week, the bullpen could only then be described as a derailed train. The entire pitching staff gave up a total of 31 runs (25 earned runs) in four games, walking 27 while allowing 40 hits and striking out 36 for a strikeout to walk rate of 1.33. The team ERA is currently 11.97, and while the rotation’s group ERA is ugly at 6.16, the bullpen’s collective ERA is 17.78. Mike Montgomery is the sole reason for the bullpen, and team era is so, as his ERA now stands at a horrific 81.00, but Even with factoring Monty out of the equation, the team ERA remains at 7.45, and the bullpen ERA still sits at 8.74. While the starting rotation has posted a 1-1 record, the bullpen is winless, losing two games and allowing four lead changes in just 11.1 innings of work. It’s not all been bad in the bullpen though, as, without 0.00 ERAs from Brach, Kintzler, Cishek, and Rosario, things would be a lot uglier. Of the reliever’s that have given up runs, Tyler Chatwood has the lowest ERA (16.20), while after Montgomery’s 81.00, Edwards has the worst ERA at 27.00. Nearly every hit the bullpen has allowed has become an earned run (11 ER on 12 hits, or 91.7%), while the rotation’s hits-to-earned- runs stand at 50% (14 ER, 28 hits).
Much like with offensive ratings, everything is proportionate for the pitching staff. The pitchers have been rated and ranked on their own set of criteria: Hits, earned runs, walks, home runs, HBP and WP all carry negative points, while strikeouts are worth positive points. I’ve included Tyler Chatwood and Mike Montgomery in the rotation and bullpen sections, as they’d likely become the backup starters. There you have it, a current rundown of the Cubs offensive and pitching statistics, trends, ratings, and rankings. The next off-day is on April 18th, at which time I will recalculate everything, with the updated version being posted before the game on the 19th. What do you think? Send me your feedback: Ken@cubshq.com. Cubs’ Offense: The Basics
Cubs’ Pitching: The Basics
Cubs’ Pitching: Ratings and Rankings