Ranking the Cubs hitters in offensive performance |
CHICAGO -- Suppose batter A has 40 home runs, and batter B has 40 home runs. Let’s call batter A Miguel Cabrera and batter B Adam Dunn. Clearly, if you had to choose between the two to be on your team, you would pick Cabrera. We all know the Adam Dunn scenario – a guy who can hit lots of home runs but strikes out four or five times as much.
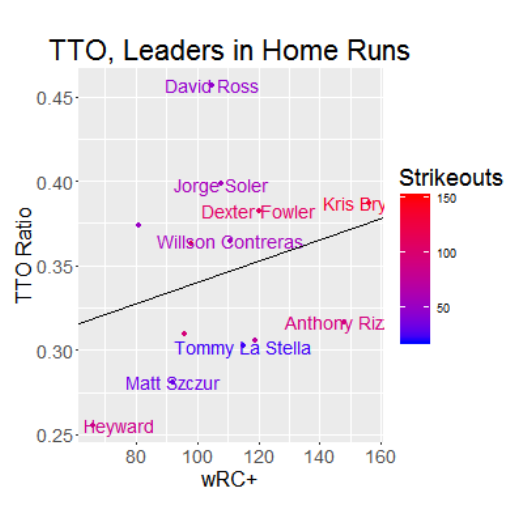
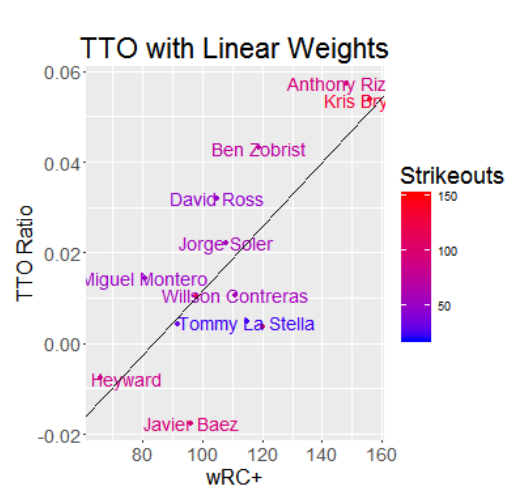
For batters, there are three statistics that take defensive players out of the equation: home runs, walks, and strikeouts. These are called the “Three True Outcomes” and if you put it as a ratio over plate appearances, you get a pretty high ratio for power hitters. In fact, the career leaders are Adam Dunn, Ryan Howard, and Jack Cust. It also includes Barry Bonds, Mark McGwire, and Jim Thome, players with much larger skill sets. Clearly, not all Cubs hitters are like this. But the two players who would be close to these measures would be Kris Bryant and Anthony Rizzo, who happen to also lead Cubs hitters in WAR. I’ve plotted the Cubs qualified hitters (minimum 100 PA) by measuring their TTO ratio and their weighted runs created, adjusted to ballpark effects (wRC+). This is to test and see if TTO has a significant relationship with wRC+, if there is one. (Note: some names do not appear due to overlap) The color represents the number of strikeouts each player has, to judge whether or not a Cubs player’s TTO ratio is heavily influenced by strikeouts. With this graph, it appears that Bryant fits right with the curve – despite a lot of strikeouts, he hits a good amount of home runs and walks enough to have a decent ratio. Plus, he is such an effective hitter that his wRC+ stands out among everyone else. Three players stand out in this picture: Jason Heyward, David Ross, and Anthony Rizzo. Heyward has such a low TTO ratio because he does not strike out much, but his walk rate and home run rate are some of the lowest in his career. This has contributed to his struggling performance this year (see my article about Heyward here). David Ross either walks, homers, or strikeouts in almost half of his plate appearances. To put that in perspective, he is up there with sluggers like Chris Davis, Chris Carter, and Mike Napoli. Rizzo is interesting: he has the second highest wRC+ on the team but he is lower than the curve, meaning that he does more than a “huge slugger.” For example, Rizzo has a team-best 38 doubles, indicating that he can do more than slug for home runs. The relationship between wRC+ and TTO Ratio does not appear to be linear. In fact, it seems completely scattered. I figured that strikeouts have played too much of a role in TTO when measuring performance. Why would having a high ratio of non-defensive outcomes have a negative relationship with generating runs? Instead of plotting TTO Ratio and wRC+, let’s plot a number with linear weights. Linear weights are metrics to judge how much an outcome has on run scoring. For example, if the first batter walks, the second sacrifices the runner over, and then the third batter singles that scores the first batter, who should be credited for the run? Linear weights solve that problem. Using standard linear weights, we can treat strikeouts as if it is going against a higher TTO ratio, thus relying on walks and home runs. We get a big difference: With this, we can judge where some of the Cubs players stand in terms of effective hitting without defense. Linear weights seem to have normalized many of the players, including moving some players above and below the line of best fit. Now, Rizzo is right next to Bryant, as they hold similar numbers in their linear combination between home runs, walks, and strikeouts. FYI, Dexter Fowler and Addison Russell are the points in the area of Tommy La Stella and Willson Contreras. Ben Zobrist is an interesting player on the list, as he appears to be the “third highest” on the list. For a while, Zobrist was the best hitter on the team, but has since regressed. Despite his recent slumps, he has a high walk rate, hits a good amount of home runs and doubles, and has a lower strikeout rate than Rizzo and Bryant. His OPS is also the third highest on the team. It is odd to see Javier Baez low on the graph. However, Baez rarely walks, having a strikeout-to-walk ratio of over 7. He does make up for his overall performance with his very good (or embarrassingly bad) baserunning skills and his excellent defense. In fact, he is starting to become a Gold Glove third baseman! If you were asked, “who are the best Cubs hitters?” it would be easy to answer. But if you were asked “rank the Cubs hitters in offensive performance” then analyzing the players this way seems effective. If you are interested in learning how to analyze Cubs hitters like this and make these graphs, let me know! (Evan Boyd is a senior studying statistics at the University of Wisconsin-Madison. As a writer and a data analyst, Evan is looking into sports analytics for a career. Evan also is the Station Manager at WSUM 91.7 FM Madison student radio. Feel free to reach out to him at enboyd@wisc.edu for any questions or for a resume, and follow him on Twitter @eboyd42)